Objective: The following article explains the MATLAB code to plot a figure of truss structure to scale
MATLAB Functions used: line( ), min( ), max( ), length( ), viscircles( ), patch( ), etc
Other features: THe supports and loading are also depicted in the plots. The load values and directions are clearly indicated in color
MATLAB Code:
function drawtruss2D(NODE,ELEM,L_BC)
figure;line([NODE(ELEM(:,1),1) NODE(ELEM(:,2),1)]',[NODE(ELEM(:,1),2) ...
NODE(ELEM(:,2),2)]','Color','b','LineWidth',2,'Marker','o',...
'MArkerSize',8,'MarkerFacecolor','w');hold on;
minX=min(NODE(:,1));maxX=max(NODE(:,1));minY=min(NODE(:,2));maxY=max(NODE(:,2));
rangeX=maxX-minX;rangeY=maxY-minY;
xlim([minX-0.2*rangeX maxX+0.2*rangeX]);ylim([minY-0.2*rangeY maxY+0.2*rangeY]);
axis equal
if nargin==3
nl=rangeX*0.10;nb=rangeY*0.05;
for o=1:length(L_BC)
OType= L_BC{o}{1};
switch OType
case 'F'
X=[0;-nl*0.30;-nl*0.20;-nl;-nl;-nl*0.20;-nl*0.30;0];
Y=[0;nb;nb*0.2;nb*0.2;-nb*0.2;-nb*0.2;-nb;0]*0.7;
if length(L_BC{o})>4;X=X+nl;end
F=L_BC{o}{2};rot=L_BC{o}{3};
theta=rot/180*pi;
R = [cos(theta) -sin(theta); sin(theta) cos(theta)];
Trans=[X Y]*R;Xt=Trans(:,1);Yt=Trans(:,2);
Xf=NODE(F,1);Yf=NODE(F,2);
patch(Xt+Xf,Yt+Yf,[1 0 0]);
Xa=[nl*0.25 nb*0.25]*R;
if length(L_BC{o})>4;text(Xt(1)+Xf+Xa(1),Yt(1)+Yf+Xa(2),L_BC{o}{4},'FontSize',18);
else text(Xt(4)+Xf+Xa(1),Yt(4)+Yf+Xa(2),L_BC{o}{4},'FontSize',18);end
case 'H'
X=[0;-nl/4;-nl/2;-nl/2;nl/2;nl/2;nl/4;0];
Y=[0;-nb*0.8;-nb*0.8;-nb;-nb;-nb*0.8;-nb*0.8;0]*1.2;
F=L_BC{o}{2};rot=L_BC{o}{3};
theta=rot/180*pi;
R = [cos(theta) -sin(theta); sin(theta) cos(theta)];
Trans=[X Y]*R;Xt=Trans(:,1);Yt=Trans(:,2);
Xf=NODE(F,1);Yf=NODE(F,2);
patch(Xt+Xf,Yt+Yf,[0.5 1 0.5]);
case 'R'
X=[-nl/2;-nl/2;nl/2;nl/2];
Y=[-nb*0.4;-nb;-nb;-nb*0.4]*1.2;
F=L_BC{o}{2};rot=L_BC{o}{3};
theta=rot/180*pi;
R = [cos(theta) -sin(theta); sin(theta) cos(theta)];
Trans=[X Y]*R;Xt=Trans(:,1);Yt=Trans(:,2);
Xf=NODE(F,1);Yf=NODE(F,2);
patch(Xt+Xf,Yt+Yf,[1 1 0.5]);
viscircles([0 0]*R+[Xf Yf],nb*0.4,'LineWidth',5,'EdgeColor','y');
viscircles([0 0]*R+[Xf Yf],nb*0.6,'EdgeColor','k');
end
end
end
return
Typical input Files:
%Truss data for various problems
FlagNo=12;
switch FlagNo
case 1 % Single Braced Truss %Page 693 Vazirani and Ratwani
NODET=[0 0;8 0];NODE=[];for i=1:5;NODE=[NODE;NODET+[[0;0] 6*[i-1;i-1]]];end
ELEMT=[1 3;1 4; 3 4 ;2 4];ELEM=[];for i=1:4;ELEM=[ELEM;ELEMT+(i-1)*2];end
drawtruss2D(NODE,ELEM,{{'F',3,0,'30 kN',1},{'F',4,180,'30 kN'},{'R',2,0,'30 kN'},{'H',1,0,'30 kN'}});
case 2 %
NODET=[3 0;3 4;6 0;6 8];NODE=[0 0;0 8];n=4;
for i=1:n
NODE=[NODE;NODET+[6*(i-1)*ones(4,1) zeros(4,1)]];
end
ELEMT=[1 3;1 4; 2 4;3 5;4 5;2 6;5 6];ELEM=[1 2];
ELEMT1=[1 3;1 4; 3 5;4 5;4 6;2 6;5 6];
for i=1:n
if i<=n/2
ELEM=[ELEM;ELEMT+4*(i-1)];
else
ELEM=[ELEM;ELEMT1+4*(i-1)];
end
end
drawtruss2D(NODE,ELEM);
case 3 %Page 11 Vazirani
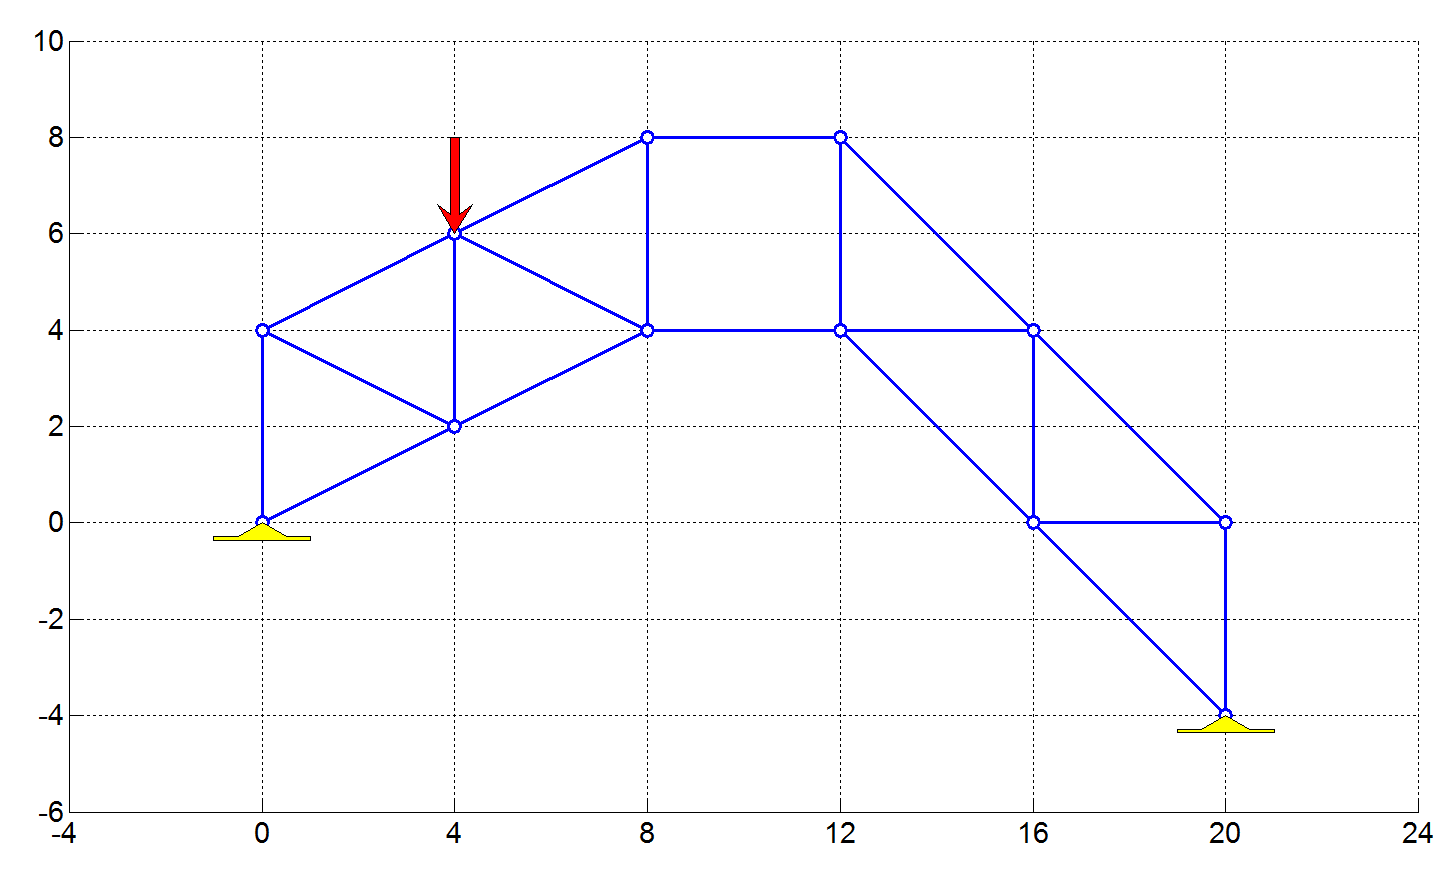
NODE=[0 0;0 4;4 2;4 6;8 4;8 8;12 4;12 8;16 0;16 4;20 -4;20 0];
ELEM=[1 2;1 3;2 3;2 4;3 4; 3 5; 4 5; 4 6; 5 6;5 7;6 8;7 8;7 9;7 10;8 10;9 10;9 11;9 12;10 12;11 12];
drawtruss2D(NODE,ELEM,{{'F',4,90,'30 kN'},{'H',1,0,'30 kN'},{'H',11,0,'30 kN'}});
case 4 %PAge 51, Negi and Jangid
NODE=[0 0;4 0; 8 0;8 -4;4 -2];
ELEM=[1 2;1 5;2 5;2 3;5 3; 5 4;3 4];
drawtruss2D(NODE,ELEM,{{'F',1,90,'P'},{'F',2,90,'P'},{'F',3,90,'P'},{'R',1,30,' '},{'H',4,0,' '}});
case 5 %PAge 51b, Negi and Jangid
NODE=[0 0;3 3; 3 0;6 6;6 0;9 9;9 0;12 6;12 0;15 3;15 0;18 0];
ELEM=[1 2;1 3;2 3;2 4;2 5; 3 5;5 4;4 6;4 7;5 7;7 6;6 8;7 8;7 9;9 8;8 10;9 10;9 11;11 10;10 12;11 12];
drawtruss2D(NODE,ELEM,{{'F',7,90,'P',1},{'R',12,0,' '},{'H',1,0,' '}});
case 6
NODE=[0 0;3 3*sqrt(3); 6 0;2.25 2.25;3.75 2.25;3 3*tand(15)];
ELEM=[1 2;2 3;3 1;1 4;2 5;3 6;4 5;5 6;6 4];
drawtruss2D(NODE,ELEM,{{'F',6,90,'P',1},{'R',3,0,' '},{'H',1,0,' '}});
case 7
NODE=[0 0;3 0;6 3;6 6;3 3;0 3];
ELEM=[1 2;2 3;3 4;4 5;5 6;6 1;1 5;5 2;5 3];
drawtruss2D(NODE,ELEM,{{'F',4,0,'H',1},{'F',4,270,'W',1},{'R',6,90,' '},{'H',1,90,' '}});
case 8
NODE=[0 0;8 0;4 3;4 0];
ELEM=[1 3;1 4;3 4;3 2;4 2];
drawtruss2D(NODE,ELEM,{{'F',4,90,'15 kN',1},{'R',2,0,' '},{'H',1,0,' '}});
case 9
NODE=[0 0;0 4;4 4;4 0];
ELEM=[1 2;1 3;1 4;2 3;3 4];
drawtruss2D(NODE,ELEM,{{'F',2,0,'P'},{'R',4,0,' '},{'H',1,0,' '}});
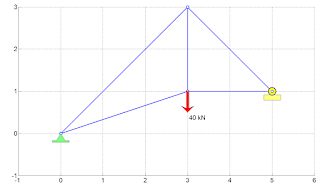
case 10
NODE=[0 0;3 1;5 1;3 3];
ELEM=[1 2;1 4;2 4;2 3;3 4];
drawtruss2D(NODE,ELEM,{{'F',2,90,'40 kN',1},{'R',3,0,' '},{'H',1,0,' '}});
case 11
NODE=[0 0;0.5 -sind(60);1.5 -sind(60);2 0;1.5 sind(60);1 0];
ELEM=[1 2;2 3;3 4;4 5;5 6;1 6;2 6;3 6;4 6;];
drawtruss2D(NODE,ELEM,{{'F',5,0,'100 kN',1},{'R',3,0,' '},{'H',1,90,' '}});
case 12
NODE=[0 0;0 3;0 6;4 0;4 3;4 6];
ELEM=[1 2;2 3;1 4;2 4;2 5;3 5;3 6;4 5;5 6];
drawtruss2D(NODE,ELEM,{{'F',6,0,'100 kN',1},{'R',4,0,' '},{'H',1,0,' '}});
end
Output plots:


MATLAB Functions used: line( ), min( ), max( ), length( ), viscircles( ), patch( ), etc
Other features: THe supports and loading are also depicted in the plots. The load values and directions are clearly indicated in color
MATLAB Code:
function drawtruss2D(NODE,ELEM,L_BC)
figure;line([NODE(ELEM(:,1),1) NODE(ELEM(:,2),1)]',[NODE(ELEM(:,1),2) ...
NODE(ELEM(:,2),2)]','Color','b','LineWidth',2,'Marker','o',...
'MArkerSize',8,'MarkerFacecolor','w');hold on;
minX=min(NODE(:,1));maxX=max(NODE(:,1));minY=min(NODE(:,2));maxY=max(NODE(:,2));
rangeX=maxX-minX;rangeY=maxY-minY;
xlim([minX-0.2*rangeX maxX+0.2*rangeX]);ylim([minY-0.2*rangeY maxY+0.2*rangeY]);
axis equal
if nargin==3
nl=rangeX*0.10;nb=rangeY*0.05;
for o=1:length(L_BC)
OType= L_BC{o}{1};
switch OType
case 'F'
X=[0;-nl*0.30;-nl*0.20;-nl;-nl;-nl*0.20;-nl*0.30;0];
Y=[0;nb;nb*0.2;nb*0.2;-nb*0.2;-nb*0.2;-nb;0]*0.7;
if length(L_BC{o})>4;X=X+nl;end
F=L_BC{o}{2};rot=L_BC{o}{3};
theta=rot/180*pi;
R = [cos(theta) -sin(theta); sin(theta) cos(theta)];
Trans=[X Y]*R;Xt=Trans(:,1);Yt=Trans(:,2);
Xf=NODE(F,1);Yf=NODE(F,2);
patch(Xt+Xf,Yt+Yf,[1 0 0]);
Xa=[nl*0.25 nb*0.25]*R;
if length(L_BC{o})>4;text(Xt(1)+Xf+Xa(1),Yt(1)+Yf+Xa(2),L_BC{o}{4},'FontSize',18);
else text(Xt(4)+Xf+Xa(1),Yt(4)+Yf+Xa(2),L_BC{o}{4},'FontSize',18);end
case 'H'
X=[0;-nl/4;-nl/2;-nl/2;nl/2;nl/2;nl/4;0];
Y=[0;-nb*0.8;-nb*0.8;-nb;-nb;-nb*0.8;-nb*0.8;0]*1.2;
F=L_BC{o}{2};rot=L_BC{o}{3};
theta=rot/180*pi;
R = [cos(theta) -sin(theta); sin(theta) cos(theta)];
Trans=[X Y]*R;Xt=Trans(:,1);Yt=Trans(:,2);
Xf=NODE(F,1);Yf=NODE(F,2);
patch(Xt+Xf,Yt+Yf,[0.5 1 0.5]);
case 'R'
X=[-nl/2;-nl/2;nl/2;nl/2];
Y=[-nb*0.4;-nb;-nb;-nb*0.4]*1.2;
F=L_BC{o}{2};rot=L_BC{o}{3};
theta=rot/180*pi;
R = [cos(theta) -sin(theta); sin(theta) cos(theta)];
Trans=[X Y]*R;Xt=Trans(:,1);Yt=Trans(:,2);
Xf=NODE(F,1);Yf=NODE(F,2);
patch(Xt+Xf,Yt+Yf,[1 1 0.5]);
viscircles([0 0]*R+[Xf Yf],nb*0.4,'LineWidth',5,'EdgeColor','y');
viscircles([0 0]*R+[Xf Yf],nb*0.6,'EdgeColor','k');
end
end
end
return
Typical input Files:
%Truss data for various problems
FlagNo=12;
switch FlagNo
case 1 % Single Braced Truss %Page 693 Vazirani and Ratwani
NODET=[0 0;8 0];NODE=[];for i=1:5;NODE=[NODE;NODET+[[0;0] 6*[i-1;i-1]]];end
ELEMT=[1 3;1 4; 3 4 ;2 4];ELEM=[];for i=1:4;ELEM=[ELEM;ELEMT+(i-1)*2];end
drawtruss2D(NODE,ELEM,{{'F',3,0,'30 kN',1},{'F',4,180,'30 kN'},{'R',2,0,'30 kN'},{'H',1,0,'30 kN'}});
case 2 %
NODET=[3 0;3 4;6 0;6 8];NODE=[0 0;0 8];n=4;
for i=1:n
NODE=[NODE;NODET+[6*(i-1)*ones(4,1) zeros(4,1)]];
end
ELEMT=[1 3;1 4; 2 4;3 5;4 5;2 6;5 6];ELEM=[1 2];
ELEMT1=[1 3;1 4; 3 5;4 5;4 6;2 6;5 6];
for i=1:n
if i<=n/2
ELEM=[ELEM;ELEMT+4*(i-1)];
else
ELEM=[ELEM;ELEMT1+4*(i-1)];
end
end
drawtruss2D(NODE,ELEM);
case 3 %Page 11 Vazirani
NODE=[0 0;0 4;4 2;4 6;8 4;8 8;12 4;12 8;16 0;16 4;20 -4;20 0];
ELEM=[1 2;1 3;2 3;2 4;3 4; 3 5; 4 5; 4 6; 5 6;5 7;6 8;7 8;7 9;7 10;8 10;9 10;9 11;9 12;10 12;11 12];
drawtruss2D(NODE,ELEM,{{'F',4,90,'30 kN'},{'H',1,0,'30 kN'},{'H',11,0,'30 kN'}});
case 4 %PAge 51, Negi and Jangid
NODE=[0 0;4 0; 8 0;8 -4;4 -2];
ELEM=[1 2;1 5;2 5;2 3;5 3; 5 4;3 4];
drawtruss2D(NODE,ELEM,{{'F',1,90,'P'},{'F',2,90,'P'},{'F',3,90,'P'},{'R',1,30,' '},{'H',4,0,' '}});
case 5 %PAge 51b, Negi and Jangid
NODE=[0 0;3 3; 3 0;6 6;6 0;9 9;9 0;12 6;12 0;15 3;15 0;18 0];
ELEM=[1 2;1 3;2 3;2 4;2 5; 3 5;5 4;4 6;4 7;5 7;7 6;6 8;7 8;7 9;9 8;8 10;9 10;9 11;11 10;10 12;11 12];
drawtruss2D(NODE,ELEM,{{'F',7,90,'P',1},{'R',12,0,' '},{'H',1,0,' '}});
case 6
NODE=[0 0;3 3*sqrt(3); 6 0;2.25 2.25;3.75 2.25;3 3*tand(15)];
ELEM=[1 2;2 3;3 1;1 4;2 5;3 6;4 5;5 6;6 4];
drawtruss2D(NODE,ELEM,{{'F',6,90,'P',1},{'R',3,0,' '},{'H',1,0,' '}});
case 7
NODE=[0 0;3 0;6 3;6 6;3 3;0 3];
ELEM=[1 2;2 3;3 4;4 5;5 6;6 1;1 5;5 2;5 3];
drawtruss2D(NODE,ELEM,{{'F',4,0,'H',1},{'F',4,270,'W',1},{'R',6,90,' '},{'H',1,90,' '}});
case 8
NODE=[0 0;8 0;4 3;4 0];
ELEM=[1 3;1 4;3 4;3 2;4 2];
drawtruss2D(NODE,ELEM,{{'F',4,90,'15 kN',1},{'R',2,0,' '},{'H',1,0,' '}});
case 9
NODE=[0 0;0 4;4 4;4 0];
ELEM=[1 2;1 3;1 4;2 3;3 4];
drawtruss2D(NODE,ELEM,{{'F',2,0,'P'},{'R',4,0,' '},{'H',1,0,' '}});
case 10
NODE=[0 0;3 1;5 1;3 3];
ELEM=[1 2;1 4;2 4;2 3;3 4];
drawtruss2D(NODE,ELEM,{{'F',2,90,'40 kN',1},{'R',3,0,' '},{'H',1,0,' '}});
case 11
NODE=[0 0;0.5 -sind(60);1.5 -sind(60);2 0;1.5 sind(60);1 0];
ELEM=[1 2;2 3;3 4;4 5;5 6;1 6;2 6;3 6;4 6;];
drawtruss2D(NODE,ELEM,{{'F',5,0,'100 kN',1},{'R',3,0,' '},{'H',1,90,' '}});
case 12
NODE=[0 0;0 3;0 6;4 0;4 3;4 6];
ELEM=[1 2;2 3;1 4;2 4;2 5;3 5;3 6;4 5;5 6];
drawtruss2D(NODE,ELEM,{{'F',6,0,'100 kN',1},{'R',4,0,' '},{'H',1,0,' '}});
end
Output plots: